flowchart LR
subgraph dt[**nsc-exporter**]
check-new-data(((data to transfer))) --> |Yes| transfer(Transfer data to TSD)
transfer --> sleep(Sleep 10 minutes)
sleep --> |check| check-new-data
check-new-data --> |No| sleep
end
subgraph dp[**2 data producers**]
lims-exporter[lims-exporter] ---> |produce| check-new-data
pipeline[NSC pipelines] ---> |produce| check-new-data
end
style dt fill:#e4eda6,stroke-width:3px
style dp fill:#F2D1FF
1 Background
GDx at OUSAMG is planning to upscale the WGS production to:
192samples (4 proj x 48or2 proj x 48 + 1 proj x 96) per week (9,216per year), with 2 NovaSeq 6000.352samples (2 fc x 64+3.5 fc x 64) per week, (16,896per year), with 2 NovaSeq X Plus416samples (2 fc x 64+4.5 fc x 64) per week, (19,968per year), with 2 NovaSeq X Plus and weekend work.
The capacity of IT & bioinformatics pipelines can be accessed in three key areas:
- Data transfer speed (this report)
- Data storage
- Pipeline capacity
2 Data transfer speed
Sequencing data and NSC pipeline results are stored at NSC and must be transferred to TSD. Due to the large data volume, the transfer is managed by nsc-exporter, which checks for new data every 10 minutes and transfers it using s3cmd put via TSD’s s3api wrapper.
2.1 Data Collection
To assess the data transfer speed from NSC to TSD, we analyzed historical transfer records from the nsc-exporter log between 2023-09-01 08:41:40 and 2023-11-30 20:14:10
Click to view examples of collected file transfer records
[,1]
datetime "2023-09-30 05:49:01"
project "wgs315"
filename "Diag-wgs315-HG72932663C12413.bam"
bytes "64816823173"
seconds "767.4"
speed "80550000"
[,1]
datetime "2023-10-07 13:54:26"
project "EKG231004"
filename "HG53787654-MAMMAE-KIT-CuCaV3_S29_R2_001.fastq.gz"
bytes "329994916"
seconds "4.2"
speed "75220000"
[,1]
datetime "2023-11-06 19:29:07"
project "wgs328"
filename "Diag-wgs328-HG60131363.cnv.vcf"
bytes "188199"
seconds "0"
speed "5890000"
[,1]
datetime "2023-10-09 19:55:04"
project "wgs318"
filename "Diag-wgs318-HG73451077C12478.sample"
bytes "1567"
seconds "0"
speed "49590"
[,1]
datetime "2023-11-30 14:46:04"
project "wgs337"
filename "231127_A01447_0418_AHKG5VDSX7.HG25933427-NevrMusk-KIT-wgs_S15_R2_001.qc.pdf"
bytes "120206"
seconds "0.1"
speed "1844160"
Excluded files
The nsc-exporter log files and the sequencer overview html files were excluded for simplicity. 1
2.2 Data Overview
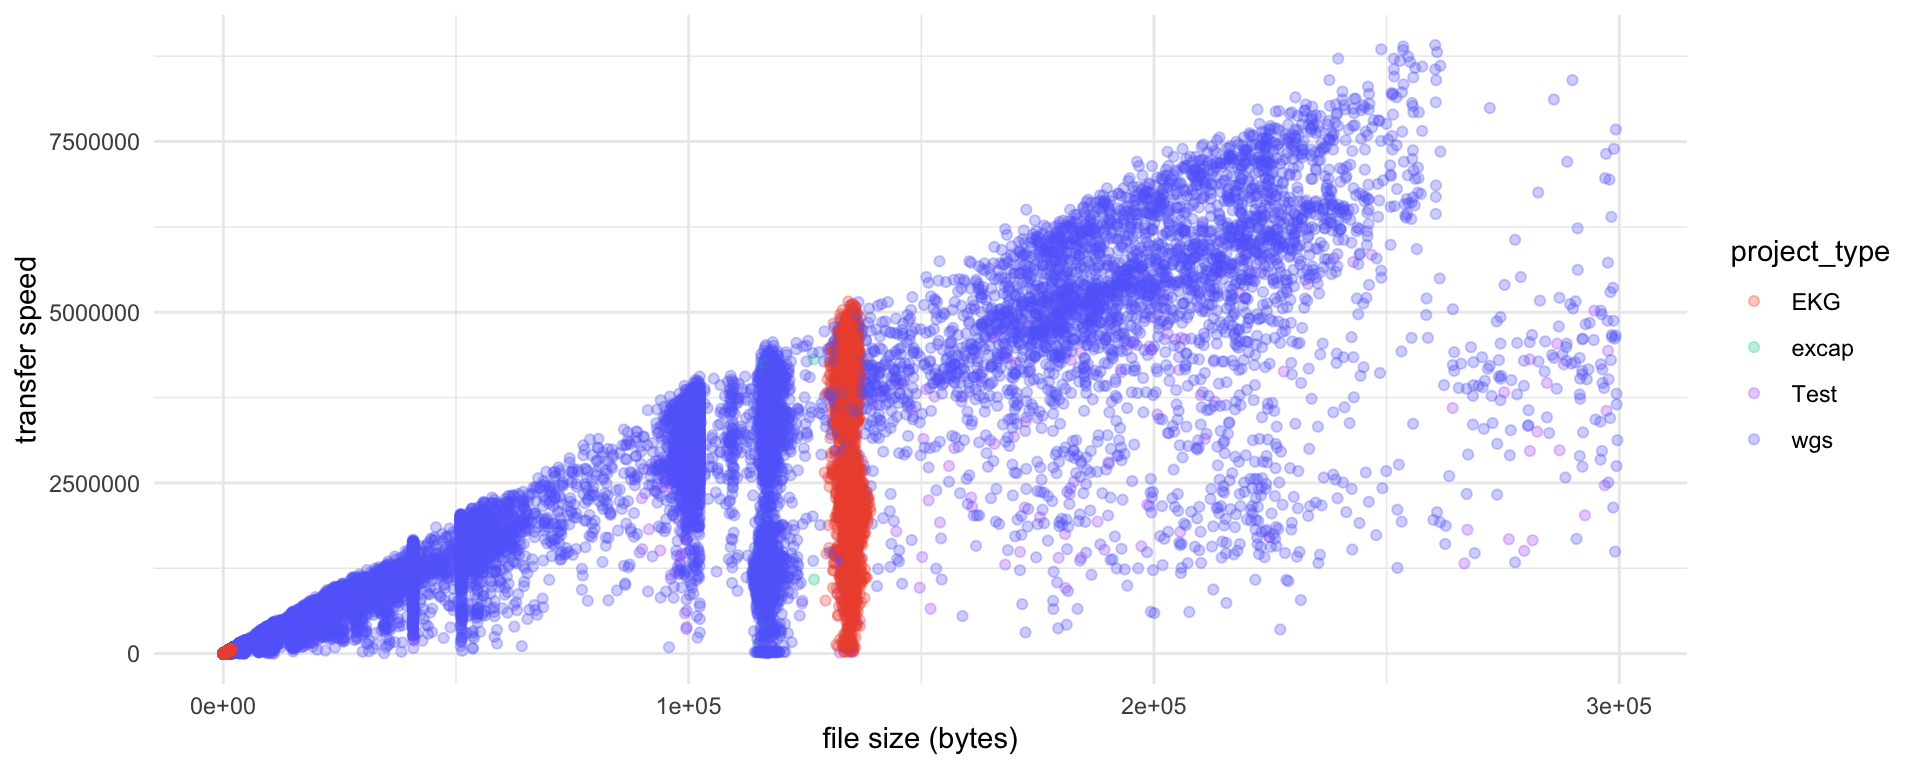
The transferred file sizes ranges from 0.0 B to 100.9 GiB, with an average of 1.5 GiB, a median of 9.3 KiB, and a standard deviation of 8.1 GiB.
filesize
Min. 0.0 B
1st Qu. 421.0 B
Median 9.3 KiB
Mean 1.5 GiB
3rd Qu. 968.0 KiB
Max. 100.9 GiB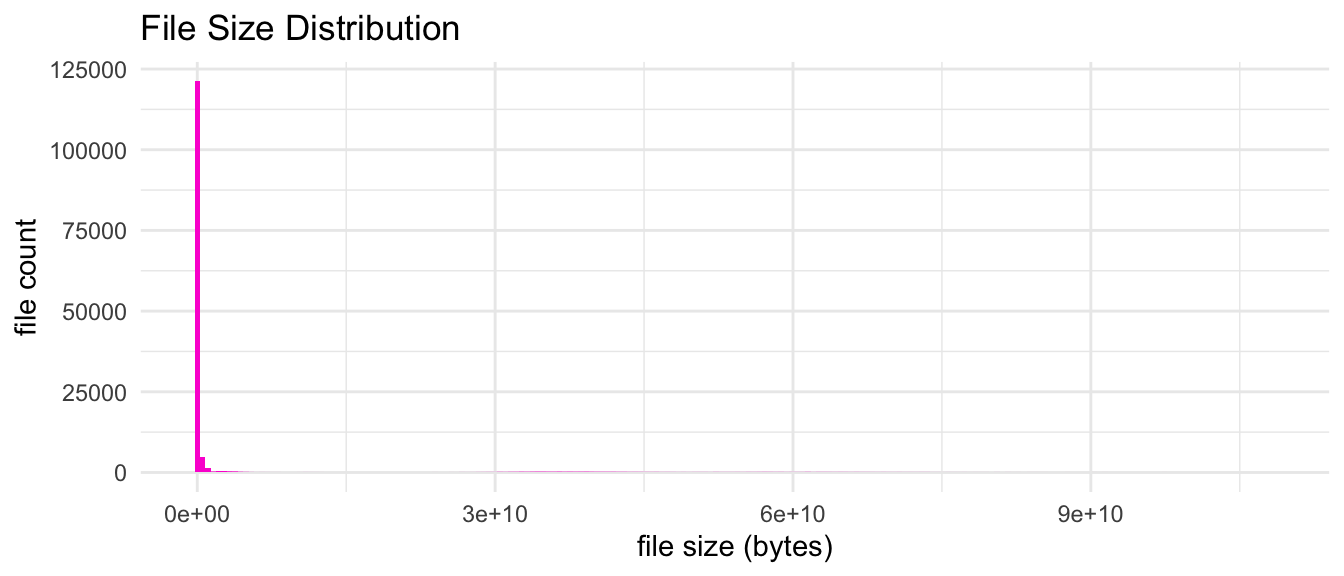
The transfer speed ranges from 1.0 B/s to 93.1 MiB/s. The average transfer speed is 12.2 MiB/s. The median transfer speed is 286.7 KiB/s. The standard deviation is 23.4 MiB/s. Transfer speed for small files is usually very low, so the average transfer speed is not a good indicator for actual transfer speed, see Section 2.3.1.
speed(/s)
Min. 1.0 B
1st Qu. 11.9 KiB
Median 286.7 KiB
Mean 12.2 MiB
3rd Qu. 8.4 MiB
Max. 93.1 MiB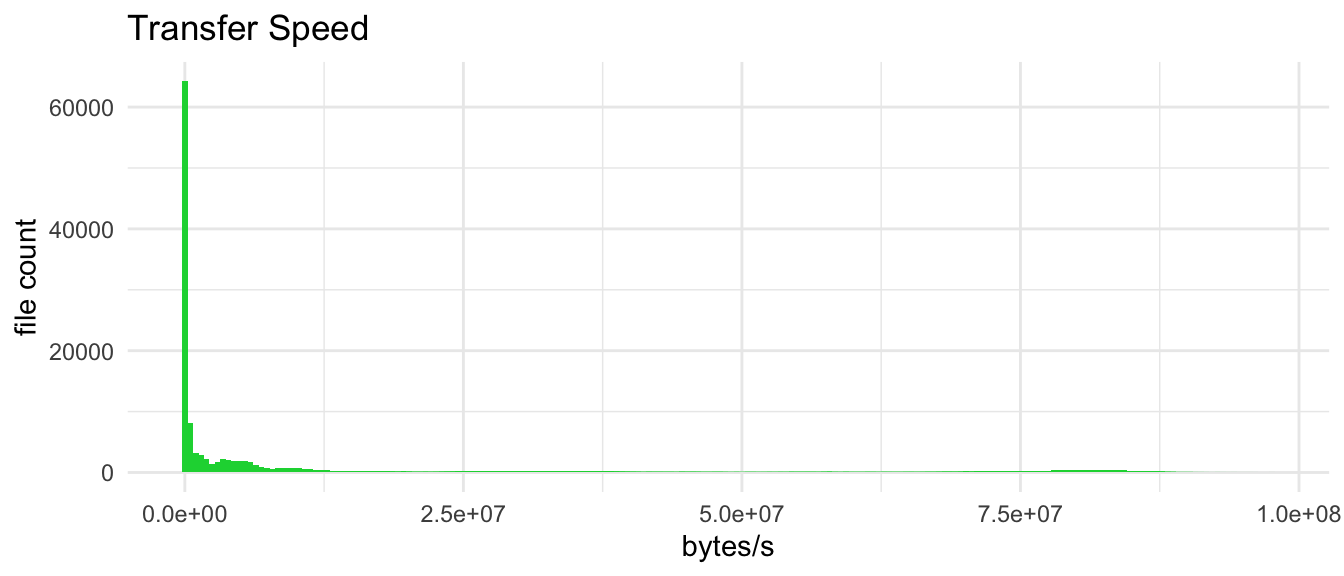
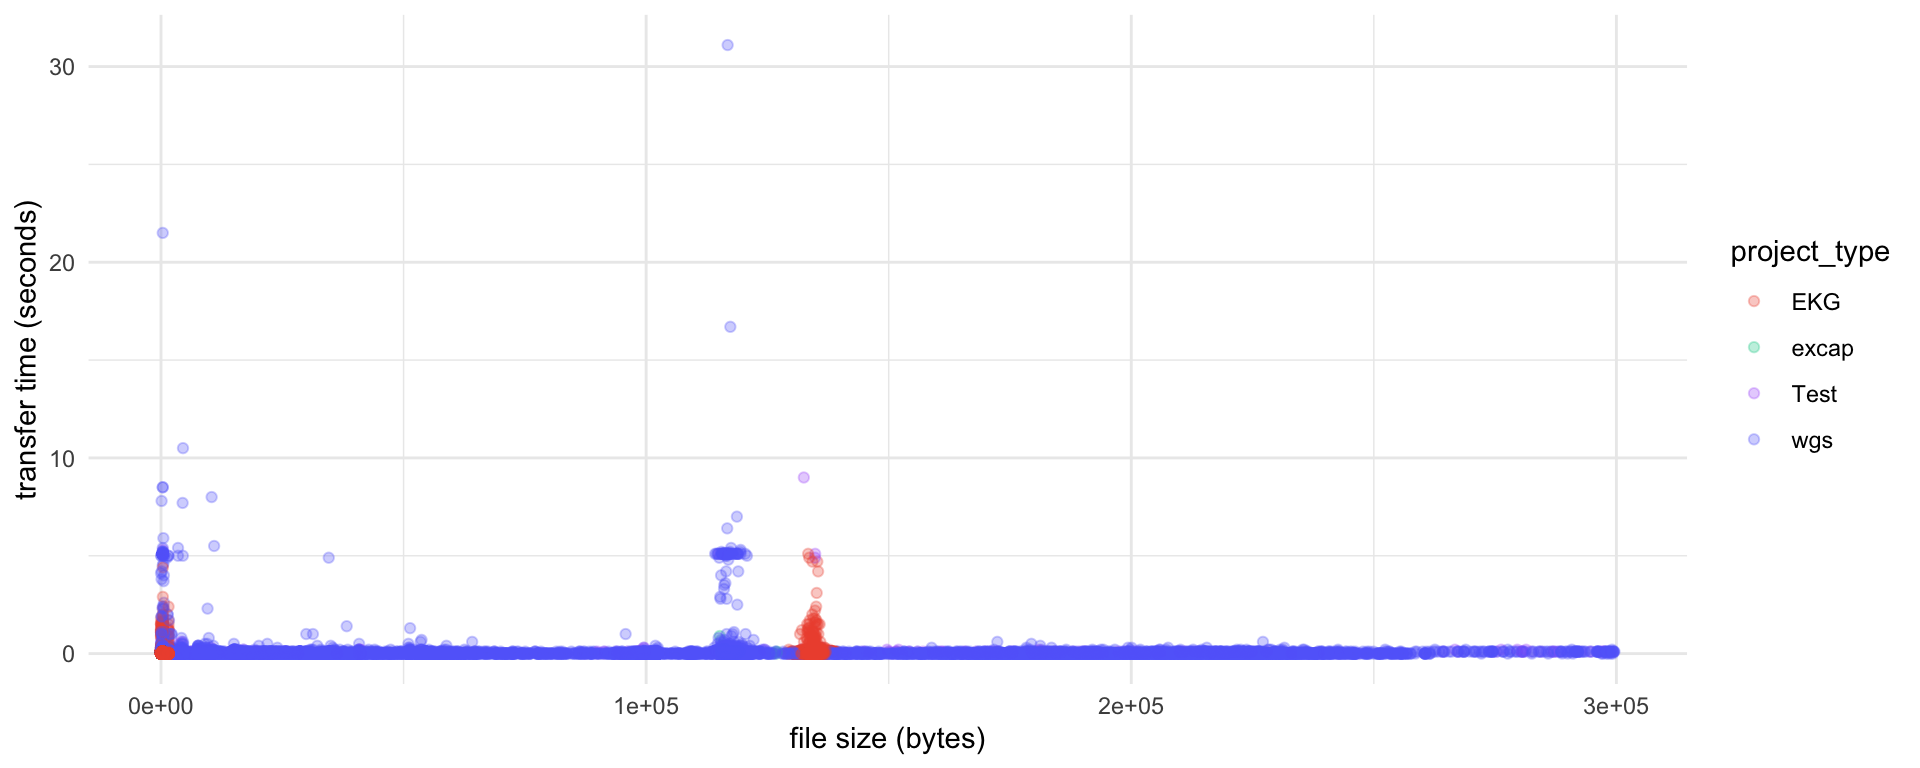
The transfer time ranges from 0 seconds to 2084.4 seconds. The average transfer time is 19.5 seconds. The median transfer time is 0 seconds. The standard deviation is 104 seconds.
seconds
Min. : 0.00
1st Qu.: 0.00
Median : 0.00
Mean : 19.47
3rd Qu.: 0.10
Max. :2084.40 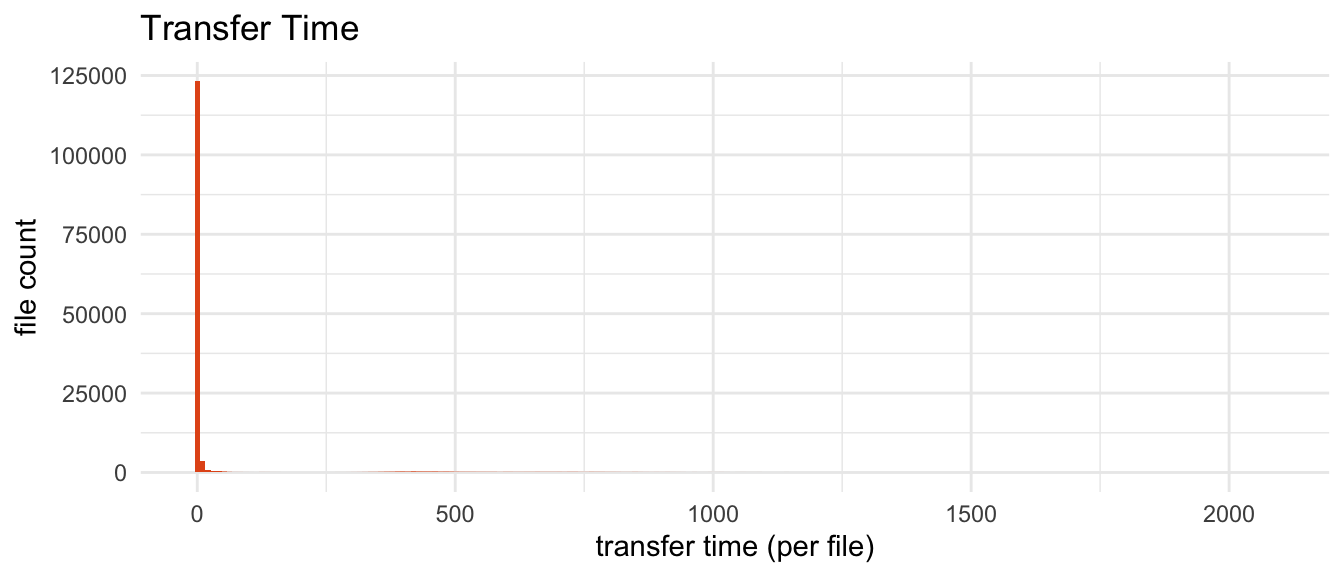
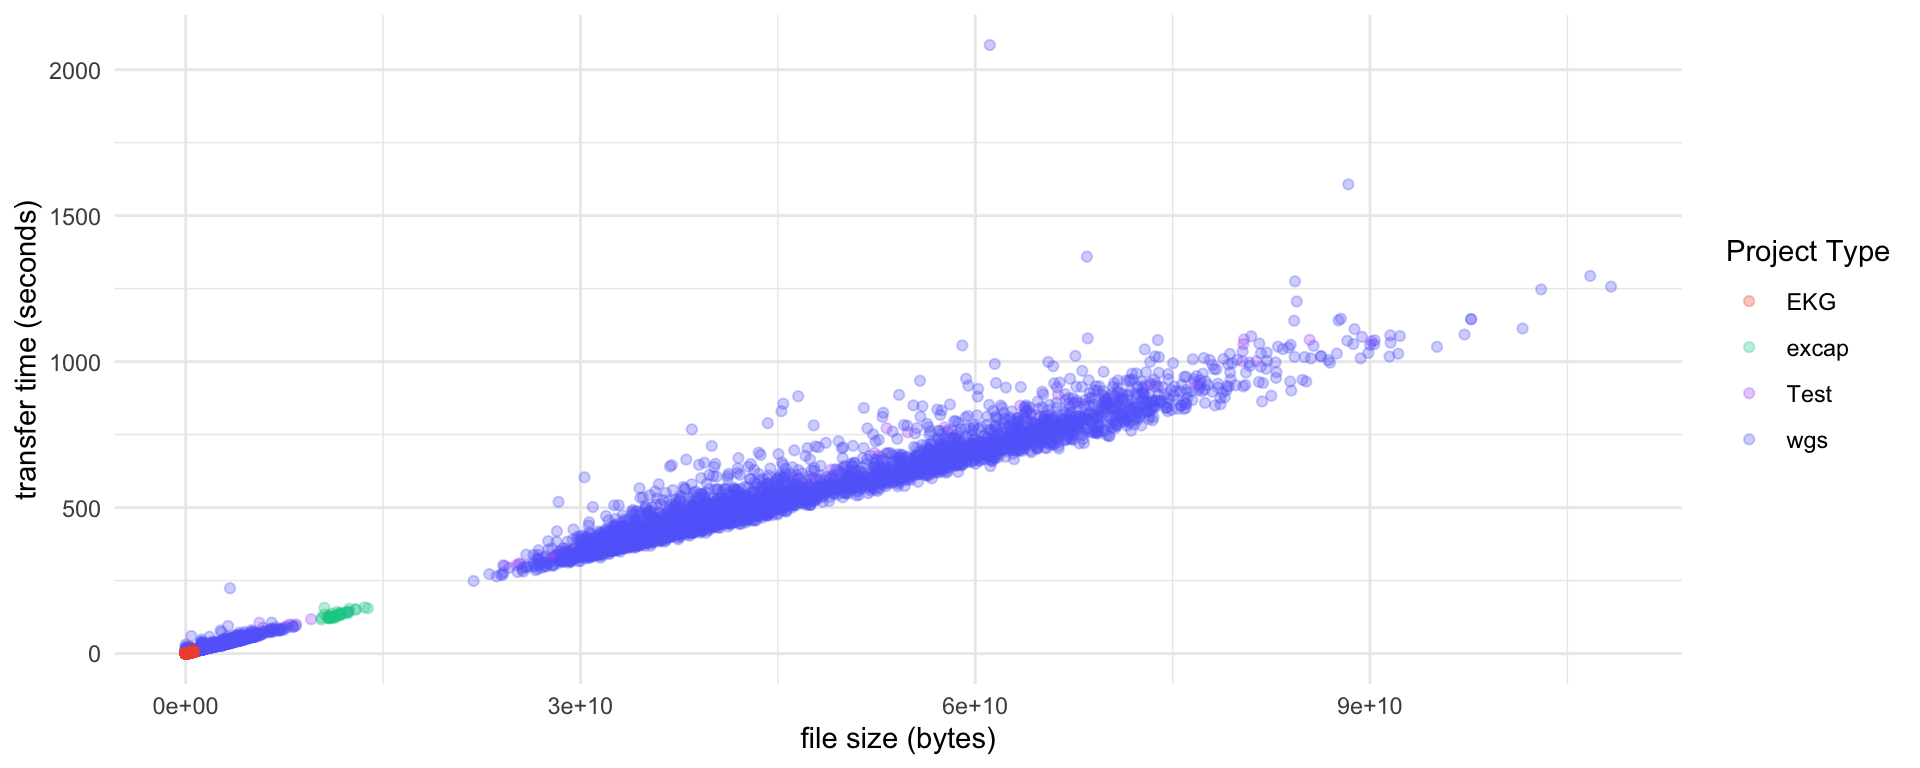
2.3 Correlation
Next, we would like to know the how does file size affect transfer speed and transfer time.
2.3.1 Transfer speed and time against file size for all files
Small files have lower transfer speed. A good transfer speed around 80 MB/s can be achieved for large files (>2 GB). However, the best speed is observed for files with size around 200 MB (zoom in or see Figure 5).
2.3.2 Transfer speed and time against file size for small files only
Although the transfer speed of small files are very low; the transfer time is usually very short. So small files are not the bottleneck of the data transfer. See also Section 2.5.1.
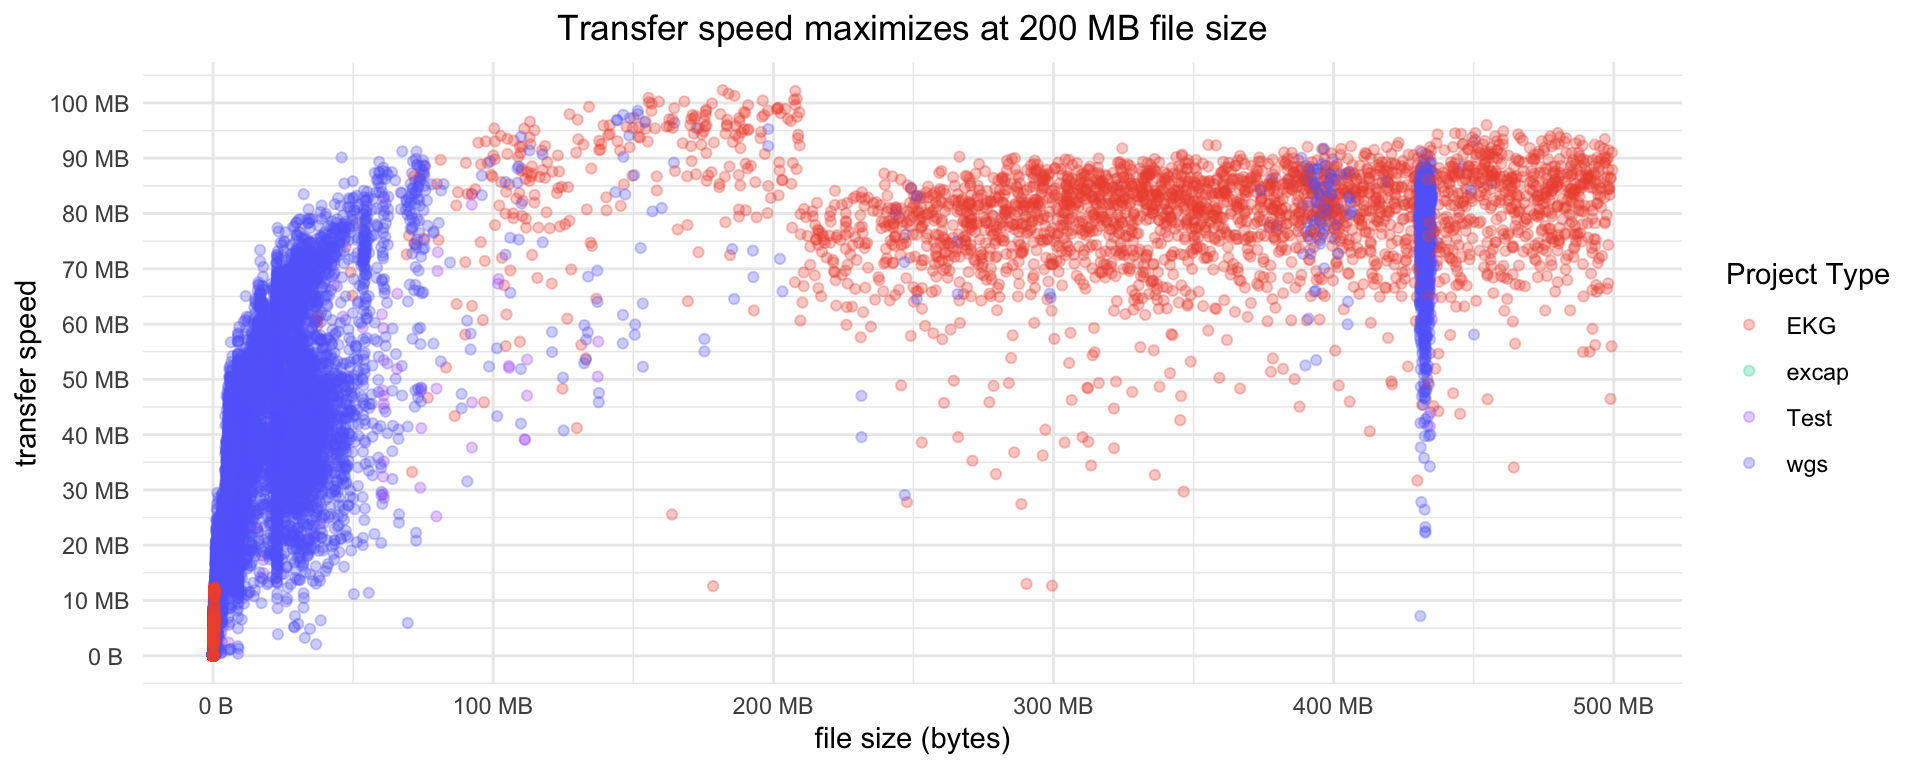
2.3.3 Maximum transfer reached around 200MB file size?
Small files have lower transfer speed. Large files have higher transfer speed. But it looks like best transfer speed is observed for files with sizearound 200 MB file size.
2.4 Idle Time
To evaluate whether there is capacity for upscaling, we need to know the idle time of the nsc-exporter. The nsc-exporter is idle when it is not transferring data.
All transfer records are plotted with starting time of each transfer on x-axis and the time used to finished the transfer on y-axis. The gaps represents idle periods of nsc-exporter. The color represents projects, e.g. wgs123, EKG20230901 etc.. The shape represents project type, e.g. wgs, EKG etc. You can turn off a project by clicking it in the legend to the right of the figure.
For easier visualization, the data is grouped in months.
2.4.1 September
2.4.1.1 Per file transfer time
2.4.1.2 Idle time
2.4.1.3 Daily total
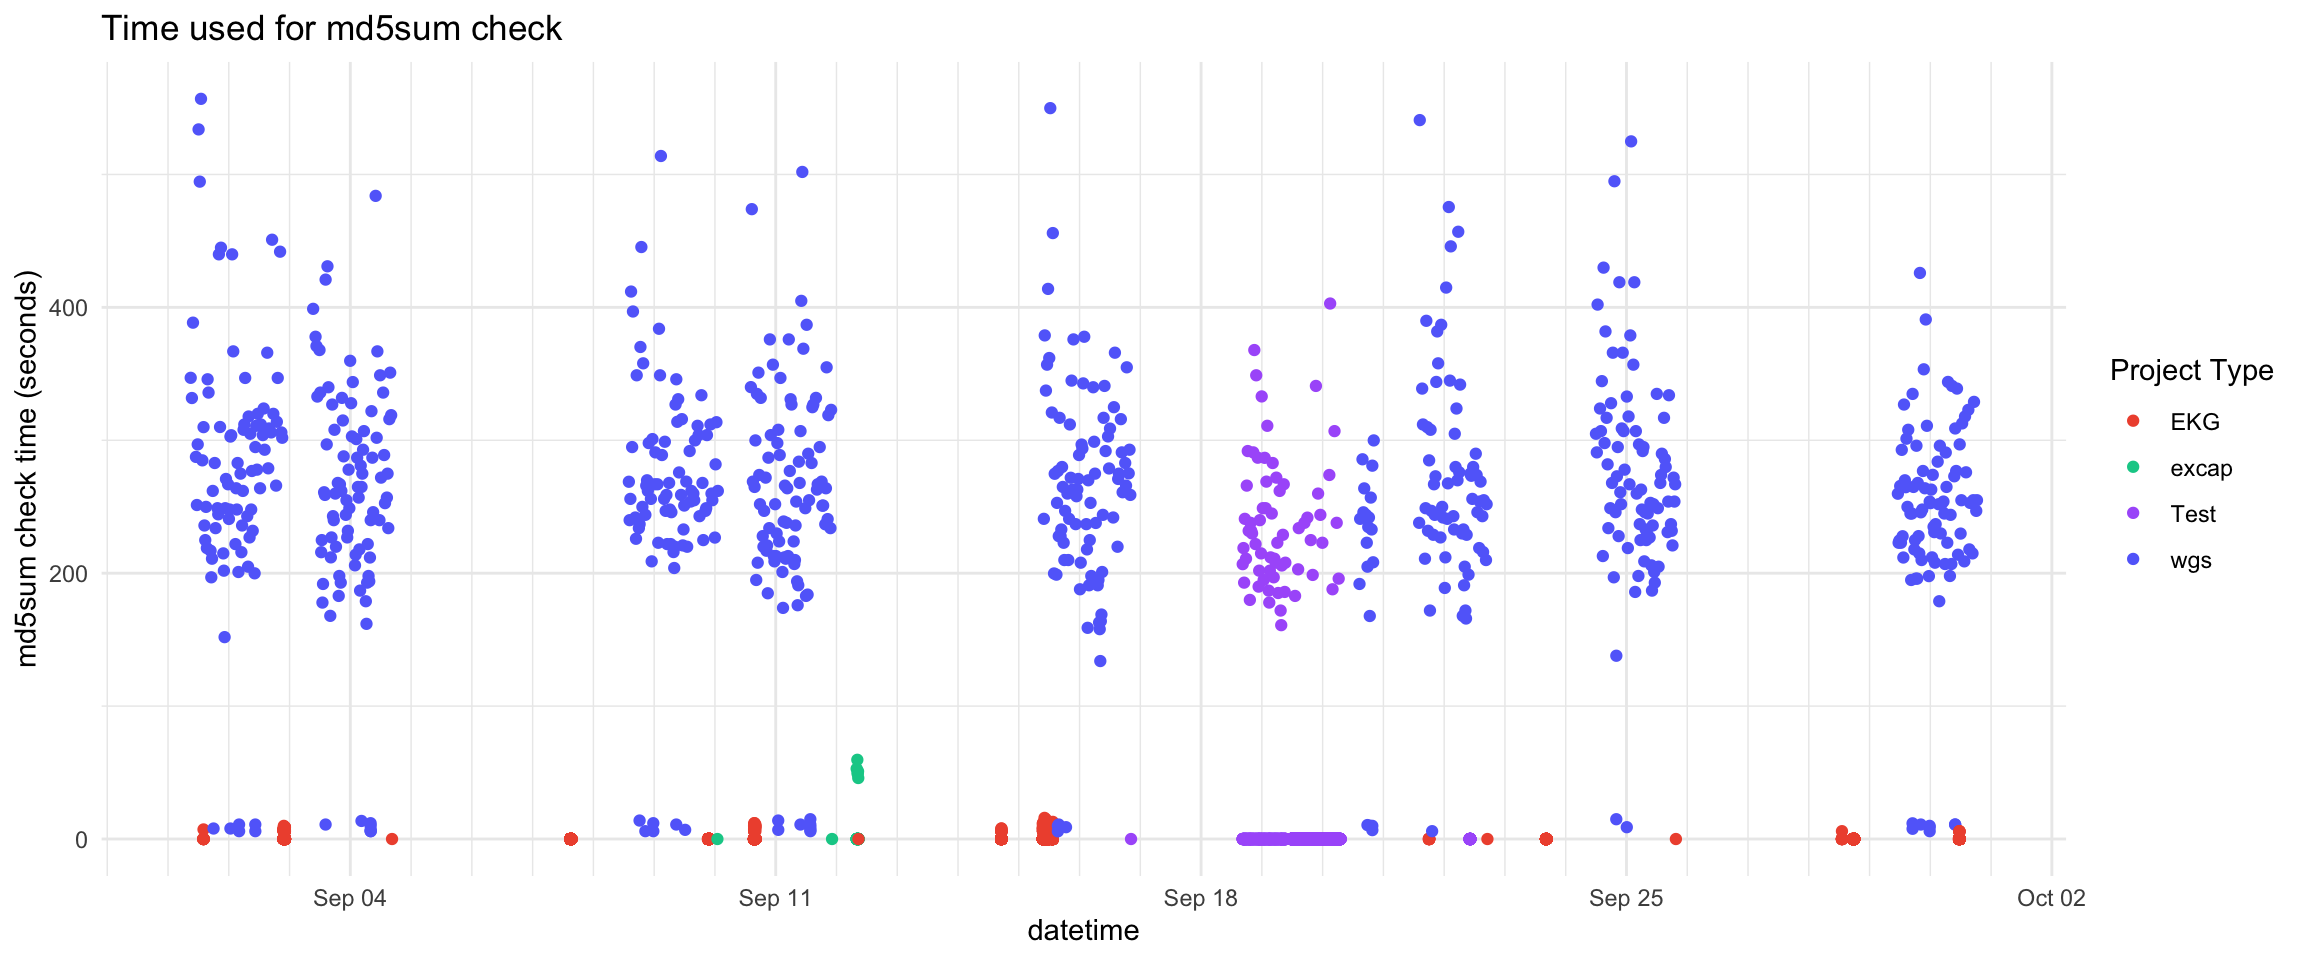
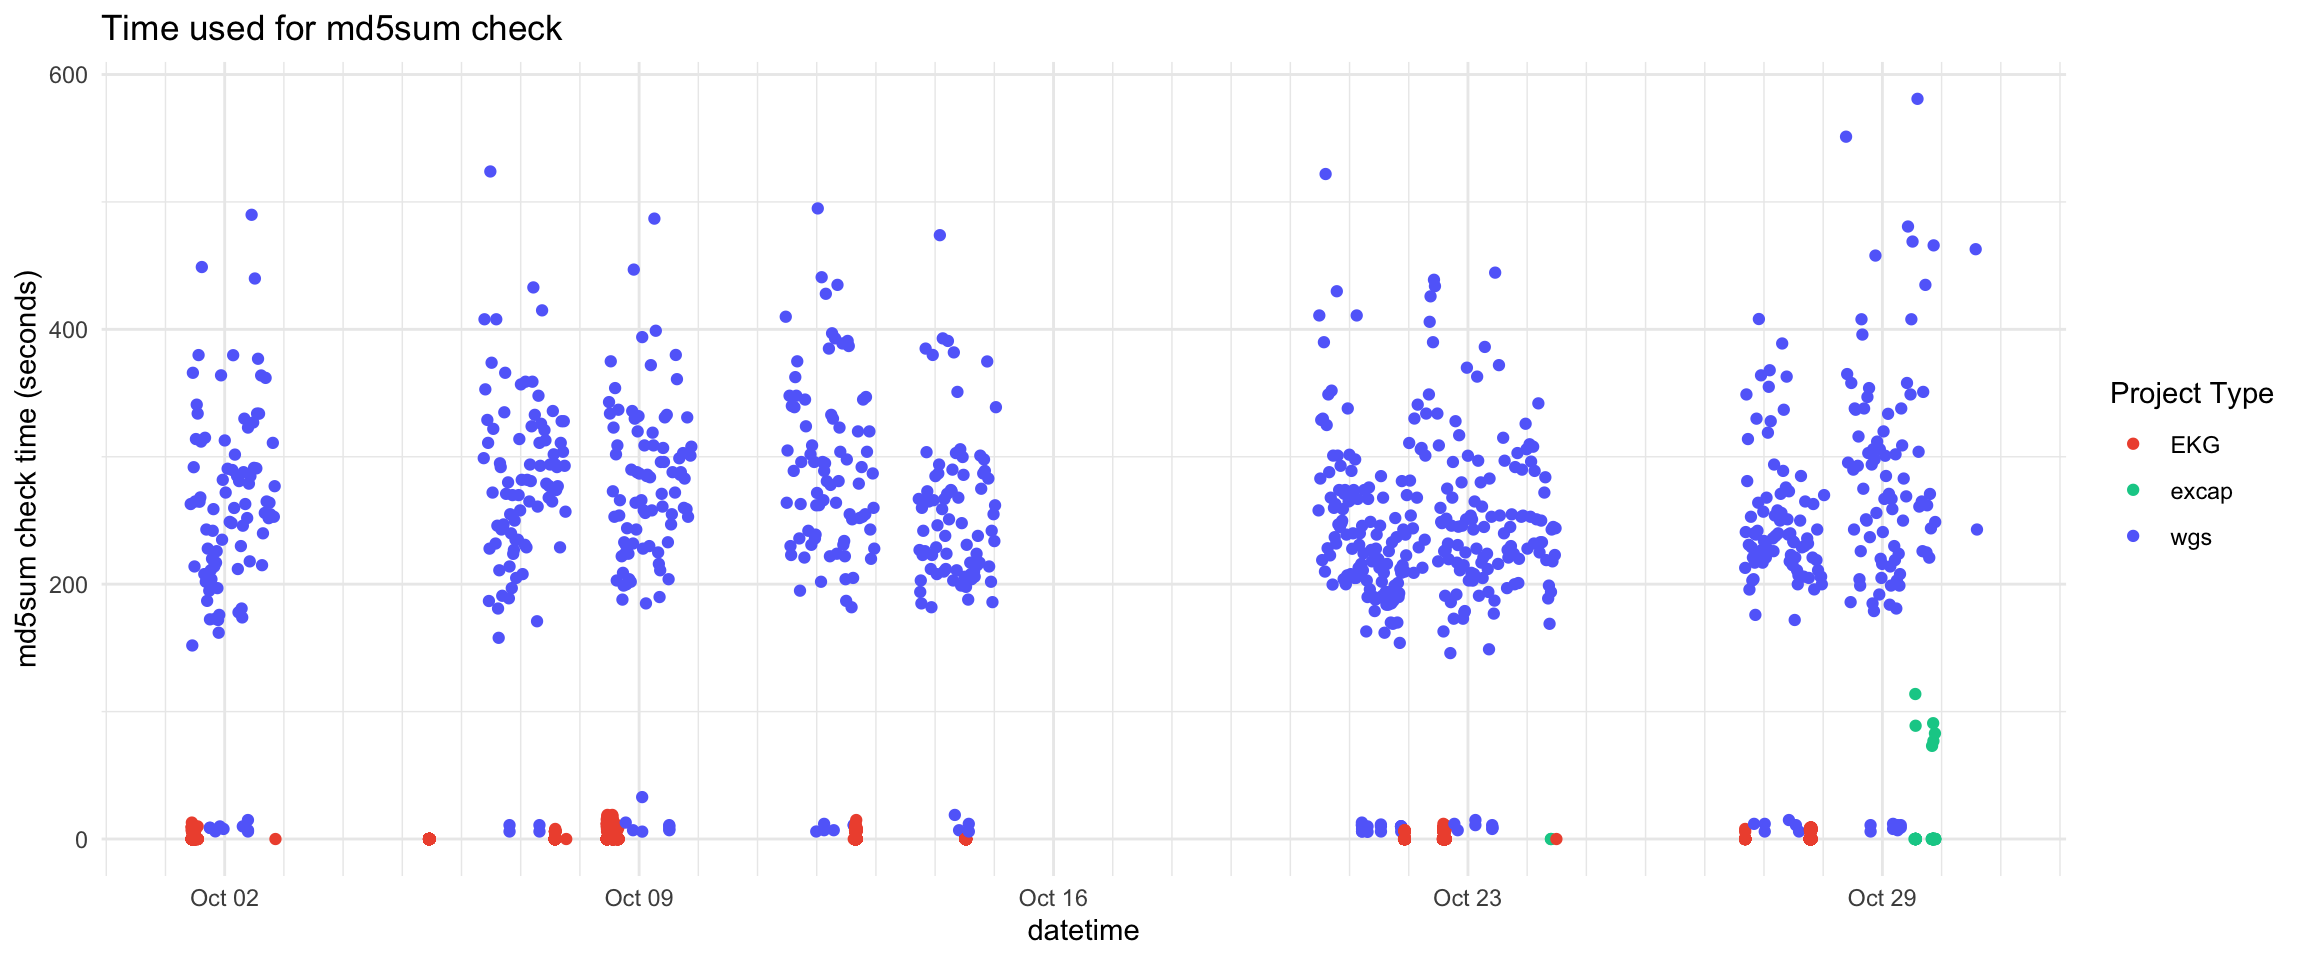
2.4.1.4 md5 check time
2.4.1.5 Summary
Attention
Total absolute time used for transferring files in September is 8 days, 20 hours, 35 minutes and 57.20 seconds. In total 62.9 TB data was transferred including 8 new wgs projects.
The nsc-exporter will sleep 10 minutes before checking for new data to transfer. In September, nsc-exporter slept 173 times, totally 1 day, 4 hours and 50 minutes. 3
Another type of time used is the md5sum checking by
s3cmd putcommand which is not counted in the absolute transfer time. 4 The total time used for md5sum checking in September is 2 days, 7 hours, 12 minutes and 44.50 seconds.
2.4.2 October
2.4.2.1 Per file transfer time
2.4.2.2 Idle time
2.4.2.3 Daily total
2.4.2.4 md5 check time
2.4.2.5 Summary
Attention
Total absolute time used for transferring files in October is 9 days, 16 hours, 5 minutes and 58.40 seconds. In total 71.4 TB data was transferred including 10 new wgs projects.
The nsc-exporter will sleep 10 minutes before checking for new data to transfer. In October, nsc-exporter slept 319 times, totally 2 days, 5 hours and 10 minutes.
The total time used for md5sum checking in October is 2 days, 14 hours, 50 minutes and 37.70 seconds.
2.4.3 November
2.4.3.1 Per file transfer time
2.4.3.2 Idle time
2.4.3.3 Daily total
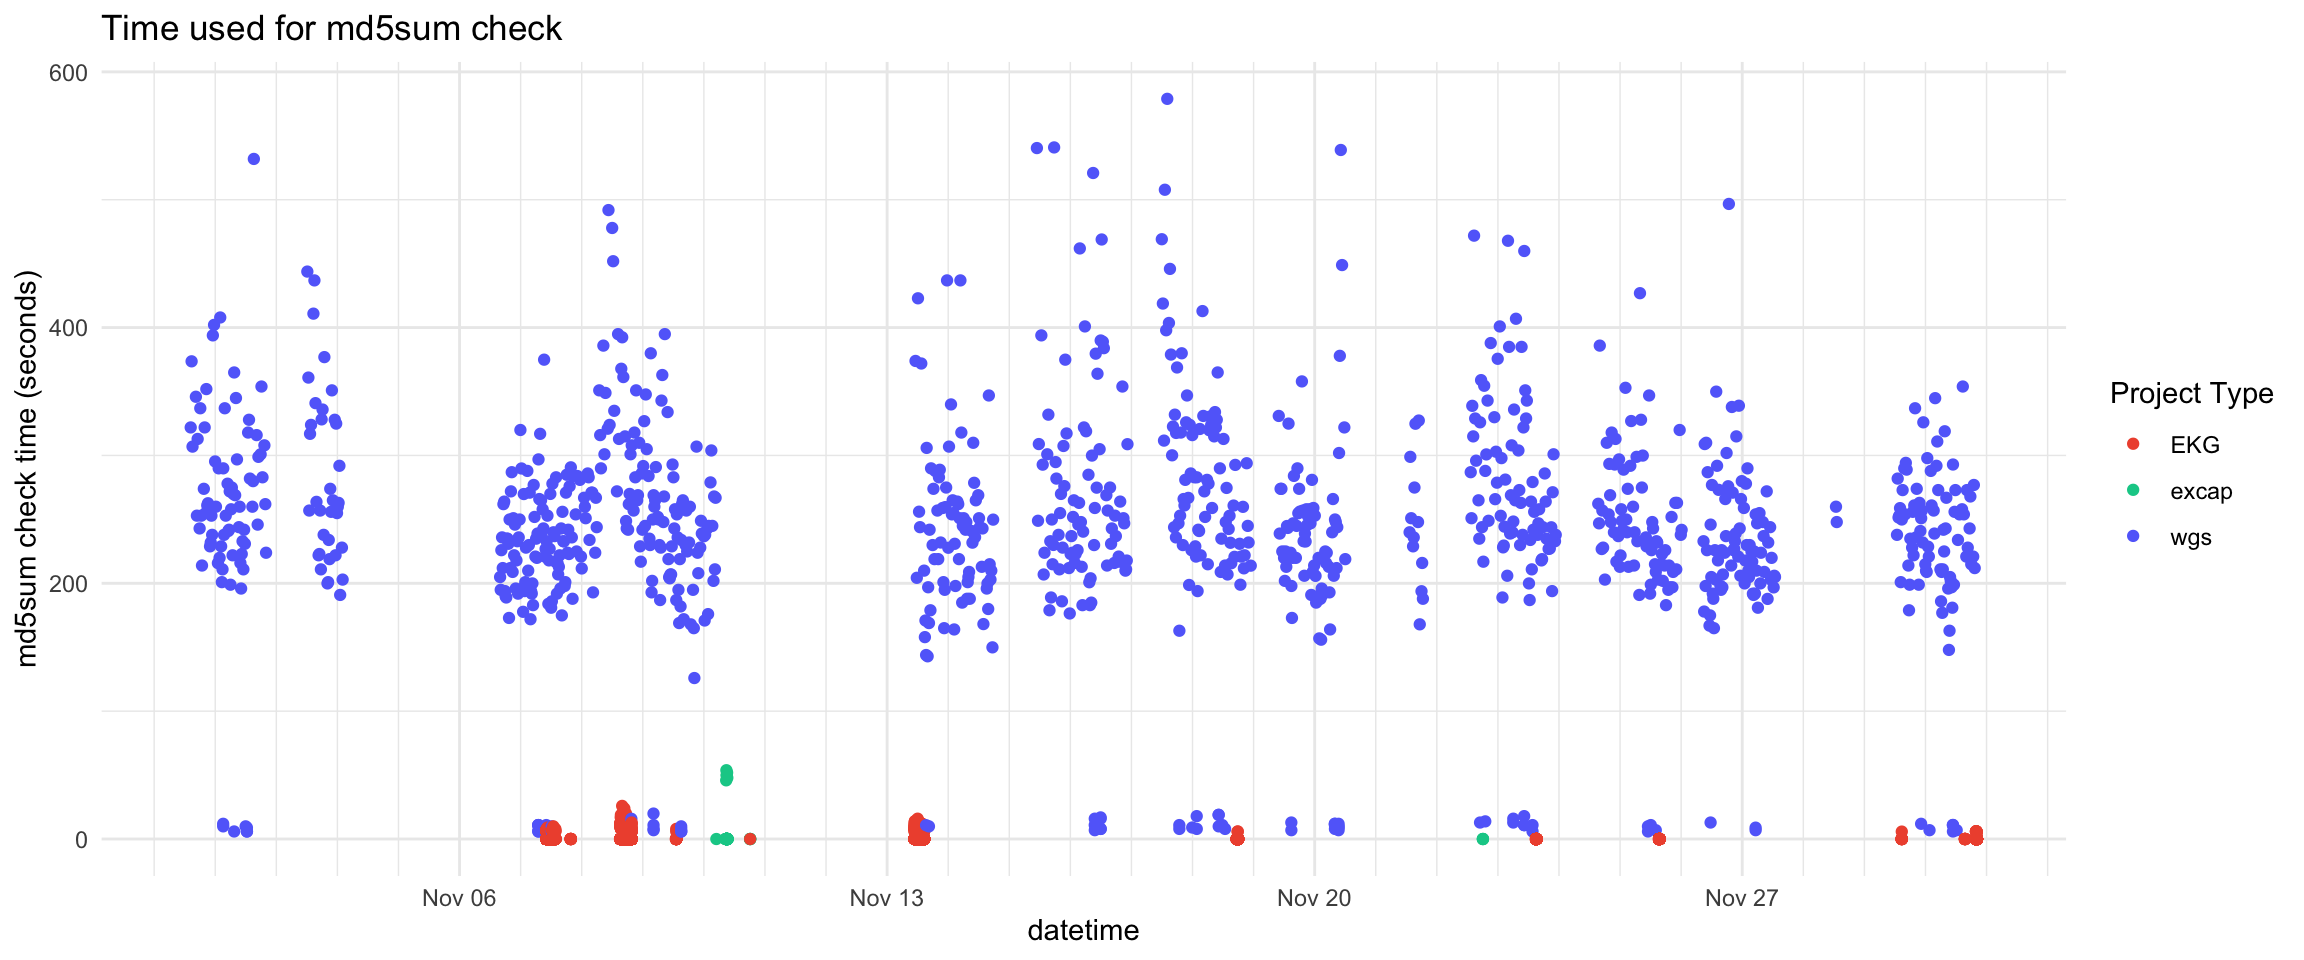
2.4.3.4 md5 check time
2.4.3.5 Summary
Attention
Total absolute time used for transferring files in November is 11 days, 12 hours, 49 minutes and 45 seconds. In total 83.5 TB data was transferred including 12 new wgs projects.
The nsc-exporter will sleep 10 minutes before checking for new data to transfer. In November, nsc-exporter slept 180 times, totally 1 day and 6 hours.
The total time used for md5sum checking in November is 3 days, 17 minutes and 58.60 seconds.
2.5 Discussion
Obviously, with a 10Gbps switch connecting NSC and TSD, the current transfer speed is not optimal. There can be many reasons for this, e.g. network components, software and protocol used to transfer data, the storage system I/O, CPU performance o both ends etc.
2.5.1 Do we transfer too many small files?
Figure 18 show the number of small files and the number of large files using different boundaries.
Figure 19 shows that the time used to transfer small files is neglectable.
Total time (seconds) used to transfer small vs larger files (raw data)
| threshold | small files total time(s) | large files total time(s) | |
|---|---|---|---|
| 1 | 100 kB | 1940 | 2595561 |
| 2 | 1 MB | 4158 | 2593343 |
| 3 | 10 MB | 6746 | 2590755 |
| 4 | 100 MB | 10596 | 2586905 |
| 5 | 1 GB | 38479 | 2559021 |
2.5.2 Possibility Of an additional 48-sample run each week?
The nsc-exporter is idle for quite a portion of the time Section 2.4.
- September’s effective transfer time5 is 12 days, 8 hours, 38 minutes and 41 seconds to transfer 62.9 TB data including that of 8 wgs projects.
- October’s effective transfer time is 14 days, 12 hours, 6 minutes and 36 seconds to transfer 71.4 TB data including that of 10 wgs projects.
- November’s effective transfer time is 15 days, 19 hours, 7 minutes and 43 seconds to transfer 83.5 TB data including that of 12 wgs projects.
The maximum transfer speed is reached around 200 MB file size. Figure 5 This interestingly is the configured chunk size of
s3cmdwhich is the tool used by nsc-exporter for data transfer. We might want to increase the chunk size to improve the transfer speed of large files?The current transfer speed is not optimal considering the 10Gbps switch connecting NSC and TSD. We need to investigate the reason for the low transfer speed.
2.5.3 Calculator
2.5.4 Other questions
Does
tacltransfer data at a higher speed?
Thetacltool transfers speed is actually lower thans3cmd. Thetacltool transfers data at around 65 MB/s.CPU performance on NSC side
CPU usage on NSC side (sleipnir) is high during data transfer. It can reach 90% of a single core.Does increasing the chunk size of
s3cmdimprove the transfer speed?
The 200MB chunk size is almost the optimal size for the current setup. 2500MB chunk size is slightly better (+10%) than 200MB chunk size for very large files.Does parallelizing the transfer improve the transfer speed?
With two parallelnsc-exporterprocesses, we can achieve around 1.6x - 1.8x the transfer speed of a single process.
2.6 Conclusion
- We can run
4 x 48or2 x 48 + 1 x 96samples per week. Then the allowance for downtime is reduced to 2 days per week. - 200MB chunk size is almost the optimal size for the current setup.
- With 2 parallel
nsc-exporterprocesses, we can achieve around 1.6x - 1.8x the transfer speed of a single process with current setup. - We are waiting or the investigation of the low transfer speed on TSD side, e.g. TCP Proxy, MinIO performance, storage I/O etc.
Footnotes
The nsc-exporter log and sequencer overview html files are very small files and do not belong to any projects. They are always transferred in a very short time. They will not affect the transfer speed of other files. Therefore, they are ignored for simplicity.↩︎
Skipped wgs records where md5sum check time equals/close to zero, so project types with small files/folders such as EKG are shown.↩︎
Data comes in a continuous manner. The nsc-exporter normally takes a snapshot of new data and transfer it. It then sleeps for 10 minutes before checking for new data. The slept times counted here are where next sleep is more than the sleeping interval (10 minutes) later, signifying that new data comes right after the sleep. This is contrary to long idle time where no new data comes after the sleep.↩︎
To make sure files are transferred intact,
s3cmd putchecks the md5sum of the files. This takes time and is not reported as transfer time bys3cmdThe md5sum check is done before starting the transfer. We estimate the md5sum check time by subtracting the transfer time from the time gap between two transfers. The md5sum check time is usually less than 10 minutes, so a gap larger than 10 minutes is not considered as md5sum check time.↩︎Effective transfer time is calculated as “absolute transfer time” + “sleep time between 2 transfers” + “md5sum check time”.↩︎